By: Laura Aronoff, ORT Science Writer
When communicating our research as manuscripts, presentations and posters we use colour to emphasize our data and make figures more interesting. However, the choice of colour and particular colour combinations can make figures and images more difficult for some people to interpret.
Colour vision deficiency are a group of inherited conditions that cause difficulty in distinguishing certain colours or colour combinations. The most common form of colour vision deficiency is red-green colour vision defects. It occurs in 1 in 12 males and 1 in 200 females of Northern European descent, with lower frequencies in most other populations. Colour vision deficiencies are caused by mutations in one of three genes that comprise the light-sensitive proteins, called opsins, in the photoreceptors (cones) of the retina. Red-green colour vision defects are X-linked recessive; therefore, they are more common in males than in females. While other forms of colour vision defects are less common, the same underlying principles still apply.
It is important to note that differentiating between red and green colour combinations is not the only issue for individuals with red-green colour vision defects, but also colours for which they are a component. For example, purple is a mix of red and blue, therefore blue and purple would be a difficult combination to distinguish.
Bang Wong, the creative director at the Broad Institute at MIT, suggests ways to more effectively visualize data in his 2011 Nature Methods article. One key point that he makes relates to immunofluorescent images, which are notorious for red and green combinations. He suggests replacing either the red with magenta or green with turquoise and provides instruction on how to do this.
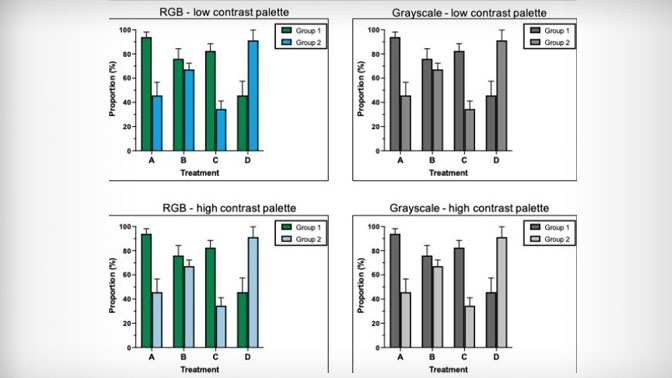
Varying the lightness and saturation of colours makes them easier to distinguish as the colours will have greater contrast. For example, light blue and dark blue are very different in lightness, therefore they have good contrast and can be easily separated from one another. Additionally, when seen in greyscale they are still easily identifiable—an added benefit if someone were to print the manuscript in black and white. Alternatively, figures can use shapes and fill patterns to identify different groups. Labelling groups rather than relying on a legend can also be helpful. Contrast can be applied to heatmaps for displaying upregulated and downregulated factors. When doing this, choose contrasting colours for the extremes, keeping in mind that “warm” colours such as reds and yellows are typically used to identify upregulated values. Additionally, contrast darker extremes with a white middle, and vice versa, to make visualization easier.
There are colour vision deficiency simulators such as Coblis, where you can upload your images and visualize them under different colour vision deficiencies to get an idea as to how accessible your images are.
With the rise of high throughput research techniques, we are generating larger amounts of data but simplifying these data into easily digestible and understandable visualizations is becoming more challenging. Purposeful colour selection can ensure that your findings are effectively communicated to everyone.


